It would also help to be able to read the charts, at least the trends, of the stock market so that informed decisions can be made. Charts are used for long-term investments as well as trading short-term fluctuations in prices since they give an understanding of price movements, trends, and probable future trends. They function like written language that can be used by investors to interpret the mood of the market and the actions taking place.
Getting Familiar with Line Charts

The first type of chart is the line chart. It displays the closing price trends for a certain period and joins the prices with a line. It does not capture the uptrend and downtrend of a single session, and this format allows for rapid appreciation of the overall trend.
Understanding Candlestick Charts
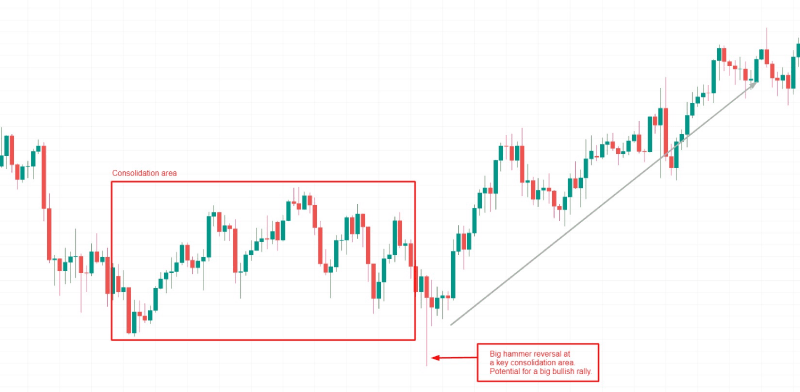
Candlestick charts have gained popularity due to their intricate and vibrant layout of the price patterns. Every candle is established for a particular time, with the opening and closing prices and the highest and the lowest prices. The actual body represents the opening and closing rates, while the wicks depict the high and low rates, respectively. For instance, doji, hammers and engulfing candles assist in identifying an expected direction in the chart.
Reading Bar Charts with Precision
Bar charts also have the potential to provide detailed information regarding price trends. The set of vertical bars presents the range of trading for a particular stock for the period of time indicated under the chart; short horizontal ticks point at the opening and closing prices. Although not graphically as pleasing as candlestick charts, bar charts provide accurate information that today’s traders employ, particularly to identify changes in momentum.
The Importance of Volume in Chart Reading
Volume is another factor of analysis, which shows the total number of shares exchanged within a certain period. The behaviour of an asset when its volume increases in combination with the price increase also signals high interest and confidence in the given direction. However, low volumetric activity, while prices rise, might indicate susceptibility or weakness. In the case of Chart MTM, volume bars at the bottom of a chart are key sign-offs for a move.
Spotting Trends with Moving Averages
Moving averages are used to average out the stock price to determine the share’s long-term trend. A simple moving average takes the average of closing prices over a fixed period. The Bollinger Bands, the upper and lower lines, are plotted two standard deviations away from the moving average. When a stock’s price is above the upper line or below the lower line, it indicates a change in trend. This tool becomes handy when learning to read stock market charts and their trends.
Using Support and Resistance Levels
In regard to chart analysis, the two horizontal lines are significant: support and resistance lines. Support is the price level at which buyers take interest and hence avert the price from dropping further. It is rather defined as the level that may stop the upward moves, which means selling pressure. These levels enable traders and investors to make the right entry and exit point decisions with a certain degree of certainty.
Recognizing Chart Patterns
Well-known patterns are present in charts irrespective of the market. Flags, triangles, head and shoulders, and double tops are some of the most popular among them. These patterns are based on the psychology of buyers and sellers and indicate upward or downward movements. Being able to recognize them in real time does give a trading edge.
Identifying Uptrends and Downtrends
Uptrends are identified by higher tops and higher bottoms characterized by increasing market prices. On the other hand, downtrends are formed when the lower top and bottom are also marked. These movements can be drawn on charts, and trend lines further represent them. It is generally wise to identify the trend before entering any position because going against it will never work.
Watching for Breakouts and Fakeouts
Based on near directly, a breakthrough is a move past a resistance level or a support level on high volume. This is seen as a possible signal that can possibly indicate the beginning of the trend. Nevertheless, there is a situation where the price moves back in the opposite direction once a breakout occurs; this is called a fakeout. When it comes to comprehending stock movements, it becomes crucial to differentiate between the two terms.
Technical Indicators for Deeper Insight
A mechanical analysis point of view provides time-based technical indicators such as relative strength index, moving average convergence divergence, and Bollinger bands that help determine whether the particular stock is overbought, oversold or in a good position to momentum change. Although not always 100% accurate, they are useful in supporting or denying indications given by the charts.
Incorporating Time Frames in Analysis
Charts can be in the framework of minutes, hours, days, weeks, months, and Years. Short-term traders may use minute or five-minute charts, while long-term traders may use their daily or weekly charts. Switching back and forth between these vantage points helps you understand fluctuations in the shorter run and the tendencies occurring in the longer run.
Emotional Discipline and Chart Interpretation
Charts reflect human emotion. All the basic emotions, such as fear, greed, and uncertainty, are reflected in the movement of the prices. It is always difficult to read charts without any sort of emotion influencing one’s decision. It may be quite challenging for one to wait until he/she sees the pattern concretely and not impose certain conditions prematurely. In fact, it is equally relevant to learn this kind of mindset for the development of skills.
Conclusion
Learning the nature of stock market charts and graphs may be easily achieved as much as acquiring a new language. It takes time or some sort of observation; in some instances, it takes practice to see it happen. Sometimes, when one can master how prices move, patterns form and volume support an action, one has direction for his or her investment. Remember that the focus keyword is how to read stock market charts and trends; the fact is that charts, in fact, do not bring the future but help to orient on it. Remain polite, continue training, and let yourself develop over time when dealing with the changing beat of the stock market.